Data analysis: is it easier in Mathematica® ?
Posted by: Gary Ernest Davis on: June 12, 2015
I wrote a post yesterday on defining functions in R for beginners. By “beginners” I mean either people who are just learning R, or are just starting out in data analysis, or both.
Today I want to show how this might be easier  to do in Mathematica®.
First let’s define the function zsf[data,k] which calculates the proportion of data that lies within k standard deviations of the mean of the given data set:
zsf[data_, k_] := Length[Cases[data, x_ /; Abs[x – mean[data]] <= k*StandardDeviation[data]]]/Length[data]
The code “Cases[data, x_ /; Abs[x – mean[data]] <= k*StandardDeviation[data]]” keeps those instances, called x, of the data set that are within k standard deviations of the mean of the data.
As in R, we import the data as a text file from a URL:
nosmokedata = Import[“http://www.blog.republicofmath.com/wp-content/uploads/2015/\06/nosmoke.txt”, “List”]
The “List” option tells Mathematica® to import the data string as a formatted (ordered) list, which in R would be seen as a vector.
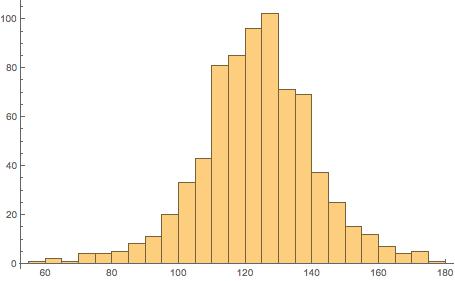
We plot a histogram of the data:
Histogram[nosmokedata]
We calculate the fraction of data that lies within 1 standard deviation of the mean and express that both as a fraction and a floating point number:
zsf[nosmokedata, 1]
N[%]
270/371
0.727763
Then we plot zsf[k] as a function of k over the range 0 through 4, subdivided into 20 equal intervals, as well as present the results in table form:
T = Table[{N[k], N[zsf[nosmokedata, k]]}, {k, 0, 4, 4/20}];
TableForm[T, TableHeadings -> {None, {“k”, “zsf[k]”}}]
ListPlot[T, Joined -> True, Mesh -> All]
Well, that’s it … the result could have been written very nicely in Mathematica® and saved as a PDF, or as a CDF and placed as an interactive document on the Web.
R has similar capabilities, so you pays your money and takes your choices.
I just feel data analysts should be aware there is a choice.
Now if Wolfram (Steve) could lower the price of Mathematica® to $50 …

![zsf[k] versus k](http://www.blog.republicofmath.com/wp-content/uploads/2015/06/zsfk-versus-k1.jpg)
![zsf[k] table](http://www.blog.republicofmath.com/wp-content/uploads/2015/06/zsfk-table-90x300.jpg)

Leave a Reply