Happy March 31 = 3/31 day
Posted by: Gary Ernest Davis on: March 31, 2013

Unemployment, 2000, for U.S. metropolitan areas: a surprising distribution
Posted by: Gary Ernest Davis on: March 26, 2013
My colleague Keith Resendes (@histogramma1) is very interested in U.S. unemployment rates, utilizing data from the U.S. Bureau of Labor Statistics.
After some data munging, I got unemployment data, 2000-2013, by metropolitan area,  from the Bureau of Labor Statistics website into R.
From there, extracting subsets of the data is straightforward. Here is the histogram – over U.S. metropolitan areas – for 2000: 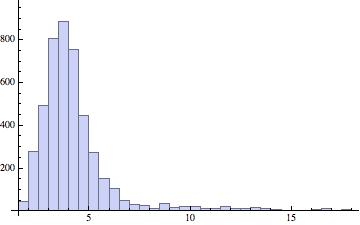 and here are the basic descriptive statistics:
Mean = 4.2
Standard deviation = 2.0
Skewness = 3.1
Kurtosis = 15.9