We should have been paying attention during Perl classes
Posted by: Gary Ernest Davis on: March 22, 2013
A joint post by Keith Resendes (histogramma.com) and Gary Davis
Image courtesy of http://translationbiz.wordpress.com
1. We found unemployment data in text format by metropolitan area, for several years (by months in fact) at a Bureau of Labor Statistics site.
2. Great! we thought: let’s read this into R using the read.table function.
3. Uh, oh! there’s not actually a header row in the data.
4. Download the data as a text file and open in a text editor.
5. Remove offending comment, pretending to be a header, and re-format headers as single words.
6. Set path to file and use read.table to read in text file as a data frame.
7. Uh oh! R doesn’t want to do that – there’s a problem with one of the columns.
8. Well duh! The 4th column has entries like “Anniston-Oxford, AL MSA ” – spaces and commas as separators.
9. There is no consistency in the table, column to column, as to what constitutes a separator. Mostly several spaces are inserted, but not always the same number – sometimes commas are used.
10. The numbers contain commas, as in 34,562
11. What a mess!
12. Who is using this data? Anyone?
13. Why hasn’t the Bureau of Labor Statistics cleaned up this data? Because no one’s using it?
14. We sort of know we could clean this up with Perl , but … as the title says … we weren’t paying attention during Perl classes.
Do you understand histograms as well as a 5th grader?
Posted by: Gary Ernest Davis on: March 22, 2013
This is a joint post of Keith Resendes (histogramma.com) and Gary Davis.
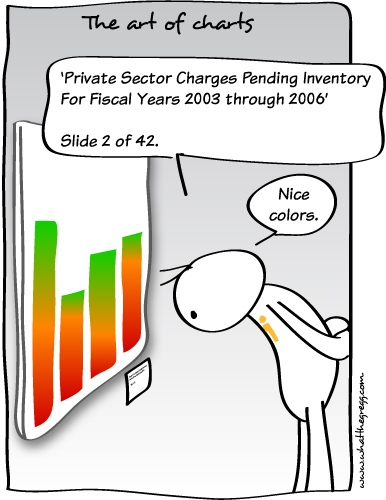
Karl Pearson described histograms – and gave them their name – in 1895. As the cartoon below suggests, people still have trouble interpreting them today:
Cartoon courtesy of www.whatthegregg.com
In our experience, even university mathematics majors, studying statistics, have trouble with the meaning of histograms.
But histograms can be explained to children in elementary school.


