Experimenting in mathematics to get a feel for what's what. Quantifying what you don't know.
Posted by: Gary Ernest Davis on: December 16, 2010
Easy to state, hard to solve, mathematics problems
Some easily stated mathematical problems are just too had for anyone currently to be able to solve.
Some outstanding examples are:
- Goldbach’s conjecture: every even number
is a sum of two prime numbers.
- the
conjecture: when we start with a positive integer and repeatedly apply one of the following two operations:
(1) if a number is even divide it by 2
(2) if a number is odd, multiply it by 3 and add 1
do we always end up with an answer of 1?
- The Tower of Hanoi problem with more than 3 pegs.
The problem is to show that the conjectured smallest number of moves to solve the puzzle is in fact smallest.
- Whether the fractional parts
of the powers of
are equi-distributed in the interval
- Whether the base 3 representation of
always contains a 2 digit for
.
- Whether
for all
.
This inequality is the remaining obstacle in the proof of Waring’s problem – a famous and outstanding problem in number theory. So even very simply stated unsolved probe can have far-reaching consequences.
The digit 2 in the base 3 representation of 
The problem of whether the base 3 representation of contains a 2 digit for
seems a simple curiosity that no one has the tools to tackle.
Extensive calculations indicate it seems to be true, but those calculations have to end somewhere, and maybe, just a bit further along, there will be a power of 2 whose base 3 representation does not contain a 2 digit.
So apart from more calculations of powers of 2, conversion of them to base 3, and examining the digits for a 2, what else could we do? What other experimental evidence could we bring to bear on this problem.
A sensible technique to “mathematize” any problem is to count: to ask how many “whatevers” are there?
So, instead of asking is there a 2 digit in the base 3 representation of , let’s ask how many 2 digits are there in the base 2 representation of
?
The question has now changed from an existential question (“Is there a needle in this haystack?”) to a quantitative question (“How many needles are there in this haystack?”).
To address this question let’s count and use basic descriptive statistics.
In other words, let’s gather some data and do a little exploratory data analysis.
How many 2’s are there in the base 3 representation of  ?
?
To calculate large powers of 2, convert to base 3, and count the digit 2, can be very time consuming.
This calls for a computational device.
A great programming language to do these calculations is Python.
But I’m not much of a Python programmer, not much of a programmer period, so I’m going to use a simple Mathematica program:
L = {};
Do[
A = IntegerDigits[2^n, 3];
L = Append[L, {n, Count[A, 2]}],
{n, 0, 10000}]
ListPlot[L, Joined -> True, PlotStyle -> {Blue}]
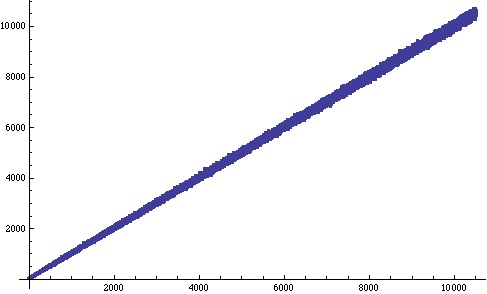
Here’s the resulting plot:
The number of occurrences of the digit 2 in the base 3 representation of seems to grow roughly linearly with
with a bit of a wobble around an average value.
Not only does the base 3 representation of contain a 2 digit, it appears to contain lots of them!
Let’s denote by the number of occurrences of the digit 2 in the base 3 representation of
.
How does compare with the running average
?
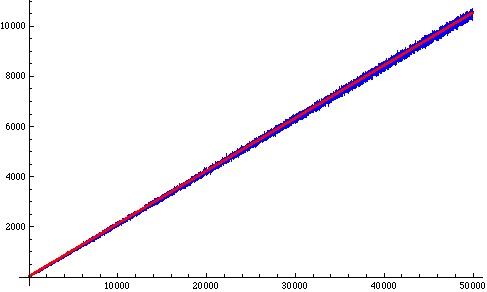
Some calculations indicate that wobbles around twice the running average. In the plot below
is shown in blue and
is shown in red:
We might loosely imagine that the closeness of the blue portion of this plot to the red line tells us that for large enough is very roughly
; that is:
Rearranging this approximation we get:
for .
Statistically, we can think of this as:
for , where
is an “error” term.
From a statistical point of view we want to know how is the error distributed.
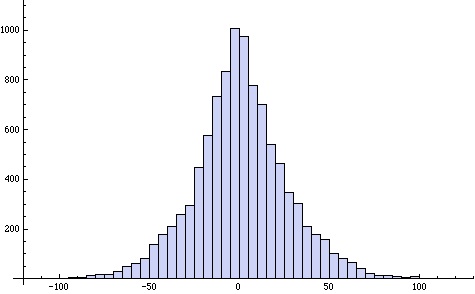
Below is a histogram of the error for
:
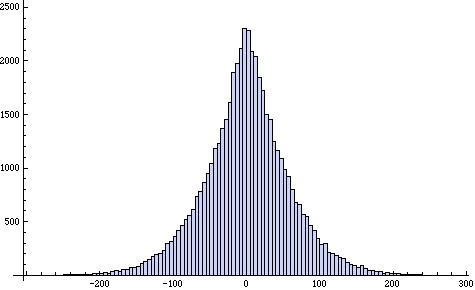 This error distribution seems quite symmetric, with a mean of approximately 0, but quite “peaky” – more so than a normal distribution.
The descriptive statistics for this distribution are:
mean = 0.0277584
stdev =59.0305
skewness = -0.0435969
kurtosis = 3.98242
So, indeed, the mean is almost 0, the distribution is quite symmetric, and the kurtosis is higher than that (3) for a normal distribution.
This is more like a logistic distribution.
As we alter the range over which we look at the error we get a distribution with a different variance.
For example, when we look at for
we get the following histogram:
This has similar features to the distribution of for
except that, notably, it has much smaller variance.
mean = 0.765212
stdev =26.2593
skewness = 0.0684994
kurtosis = 3.95492
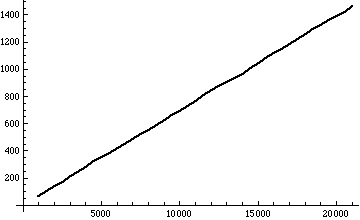
How does the variance of for
vary with
?
Almost exactly linearly it seems:
What does this tell us?
This, of course, does NOT tell us that the base 3 representation of will always have a 2 digit.
However, it does induce a degree of confidence that not only is this true, but that we can see a good reason why it might be true: namely, the number of occurrences of the digit 2 seems to grow in a relatively orderly way with increasing and that the variations we see in the number of 2’s might be understandable statistically.
This is still a long, long way off an argument, but perhaps simple counting and basic exploratory data analysis might give us the germ of a productive idea to understand better how the digit 2 occurs in the base 3 representation of .
Alongside proof, mathematics is beginning to utilize techniques of statistical analysis to obtain information about quantities of interest in mathematics.
Increasingly, statistics is being used to obtain information about mathematical quantities that previously were only analyzed in a Boolean way: either they existed or did not.
Hans Rosling's 200 Countries, 200 Years, 4 Minutes
Posted by: Gary Ernest Davis on: December 15, 2010
The video below shows a stunning example of Hans Rosling’s (@HansRosling) data visualizations using Gapminder software.

