The rise and rise of diabetes
Posted by: Gary Ernest Davis on: June 15, 2012
Diabetes is on the rise in the United States, and throughout most of the developed world.
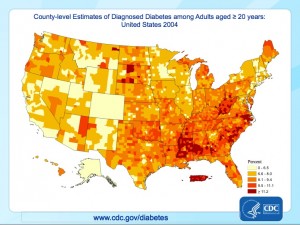
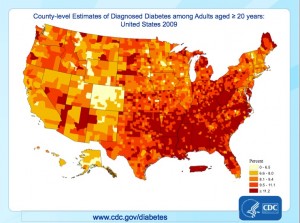
The charts below show the incidence of diabetes in the United States, by county, for 2004 and 2008 (click on the images to enlarge them):
We see that even for the short 4 year period 2004- 2008 there has been a substantial increase in the percentage of adults (20 years or older) with diagnosed diabetes.
A plot of the number of annual diagnosed cases of diabetes in the United States, 1980 -2010 shows a sharp linear rise from 1995:
The sharp increase from 1995 on is almost exactly linear:
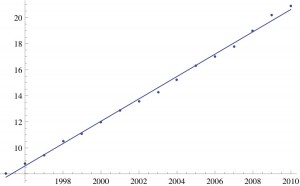
Linear increase in number of adult civilian cases of diagnosed diabetes, USA (in millions), 1995-2010. r^2=0.997
We might ask what happened in the early 1990’s that might be associated with, or a cause of, this different rate of change in annual diabetes cases after 1995?
Could it have been an increase in the production and use of high fructose corn syrup? A change in eating habits? A change in exercise habits? AÂ rise in obesity? The growth of the internet?
These are all reasonable guesses. There certainly has been a rise in obesity, yet the annual totals are not so easily obtainable as those for diabetes. Even if there is a very high correlation between obesity and diagnosed diabetes, the question still remains: what is responsible for a rapid rise in obesity?
A non-linear model of running average rates of diabetes
The annual increase of diagnosed adult diabetes in the United States is well-modeled by a linear model 1995-2010.
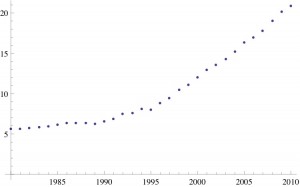
What about the cumulative moving average from 1980?
The cumulative moving average is well-modeled from 1980-2010 by a quadratic model:
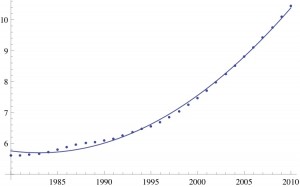
Cumulative moving average of civilian adult diabetes, USA, since 1980. A quadratic function (of the year) fits this data: r^2 =0.9999
Prediction is very difficult, especially about the future (Niels Bohr)
Projecting the linear model for 1995-2010 forward we would predict 21.5 million cases of diabetes in 2011 and 29.2 million cases in 2020.
By way of contrast, projecting the cumulative moving average quadratic model forward we would predict 21.7 million cases of diabetes in 2011 and 33.3 million cases in 2020.
[Here, we need to know that if d(n) is the number of cases of diabetes at year n and CMA(n) =(d(1980)+…+d(n))/(n+1-1980) is the cumulative moving average since 1980, where n = year, then d(n)= (n+1-1980)×CMA(n)-(n-1980)×CMS(n-1)]
Postcript
We have to wonder if an increased rate of diabetes is a consequence of rising obesity. There is no doubt that obesity is rising in the US, yet the figures going back to 1980 are not so straightforward to obtain.
One also wonders about the impact of high fructose corn syrup (HFCS) on obesity and diabetes rates. To date there does not seem to be a firm connection.
We note that:
Hank Cardello, the former head of marketing at Coca-Cola, tells me that in 1984, Coke in the US swapped from sugar to HFCS (In the UK, it continued to use sugar). As a market leader, Coke’s decision sent a message of endorsement to the rest of the industry, which quickly followed suit. There was “no downside” to HFCS, Cardello says. It was two-thirds the price of sugar, and even the risk of messing with the taste was a risk worth taking when you looked at the margin, especially as there were no apparent health risks. At that time, “obesity wasn’t even on the radar” says Cardello.

Leave a Reply