Those pesky percentages
Posted by: Gary Ernest Davis on: January 13, 2011
Percentages seem to be a perennial problem.
Many people have trouble figuring out percentages when circumstances – usually something at work – requires them to do so.
Even the venerable Bill O’Reilly has troubles with percentages, as the following video clip shows:
<object width=”640″ height=”390″><param name=”movie” value=”http://www.youtube.com/v/04EQkUS0_Y4?fs=1&hl=en_US”></param><param name=”allowFullScreen” value=”true”></param><param name=”allowscriptaccess” value=”always”></param><embed src=”http://www.youtube.com/v/04EQkUS0_Y4?fs=1&hl=en_US” type=”application/x-shockwave-flash” allowscriptaccess=”always” allowfullscreen=”true” width=”640″ height=”390″></embed></object>
Bill says that percentages will be lower in Canada because they have a smaller population. But of course, percentages are rates: so many per 100 – and do not vary with population size.
Does this mean that Bill is stupid?
No, it means he is confused about what percentages mean.
He seems to think that percentages – of anything -Â will be lower for a smaller population.
He is not alone in this thinking, and all it means is that, like many people, he does not have good models for thinking about percentages.
What’s a useful model for thinking about percentages?
One way to think about percentages is as rates, or amounts per 100 lots.
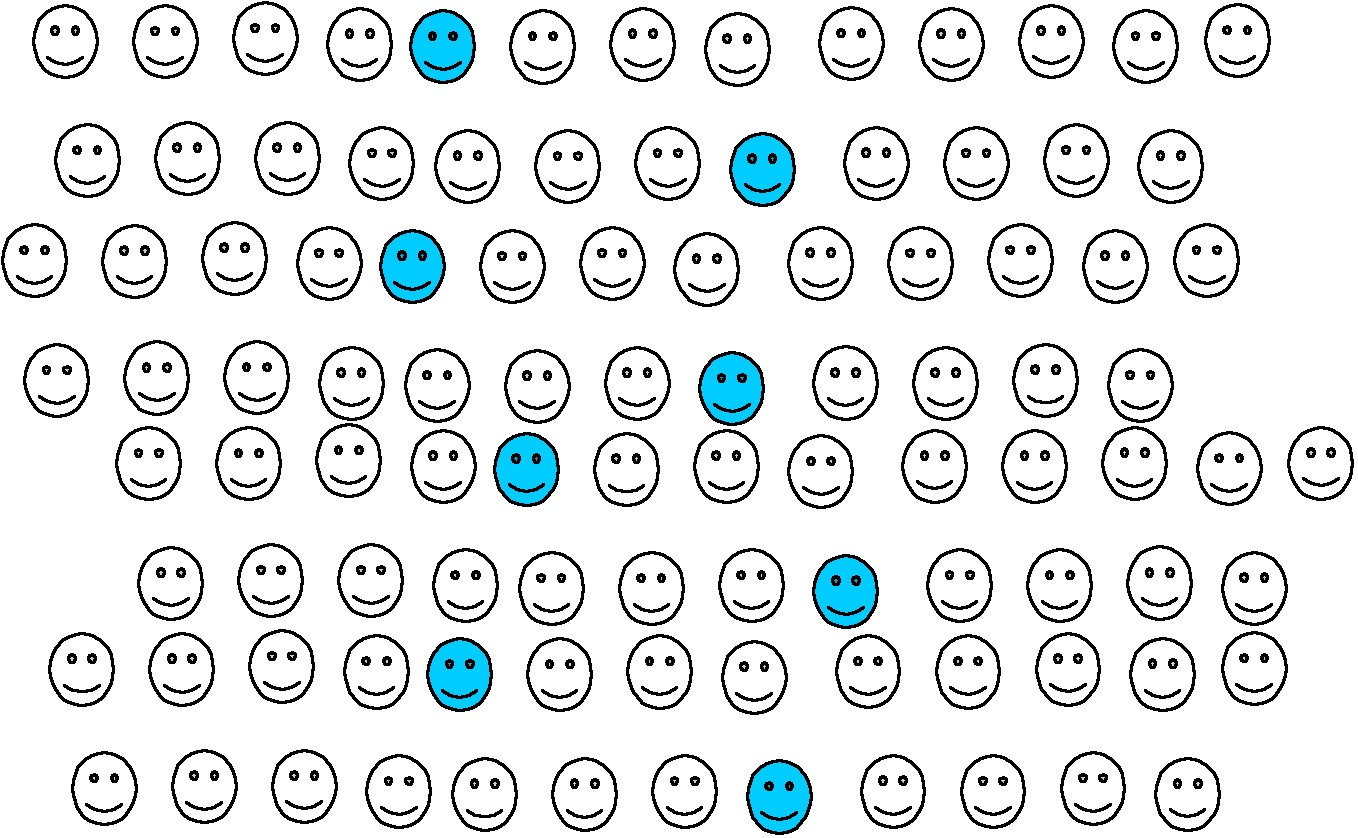
For example, if a teacher knows that, on average, 2 students in every 25 will need special attention for algebra, how does that convert as a percentage, expressed as a rate per 100?
To figure a percentage, the population of 25 has to be related to a polulation size of 100. Of course it’s an easy calculation to see that :
So in a population of 100 students there will be, on average, 8 students who need special attention for algebra.
This is 8 students for every 100 students, which we write as 8 percent or as 8%, where the “%” sign means “per 100”.
What if, in a small town of 1400 houses, 200 need new driveway paving? What percentage of the population is it that needs new driveway paving?
200 houses in 1400 is 1 in every 7. To figure this as a percentage – as a rate per 100 – we need to relate 7 to 100. This is a less easy calculation: which is nearly 100.
This means that 200 houses in 1400 is nearly 14% – 14 houses per 100.
A financier, contractor, or accountant might want a more accurate estimate than .
They might want to scale up to 1,000,000 houses, so they might want to know much more accurately how many 7’s there are in 100.
Commonly the answers to such questions are expressed not as fractions – -Â but as a decimal –
.This is still not absolutely accurate but is more accurate than estimating
as 14.
So, with this slightly more accurate calculation, 200 houses in 1400 is approximately 14.29%.
But what does this mean?
We can’t have 14.29 houses for every 100 houses: 0.29 of a house is not something we can imagine.
No, it’s not, and we are not supposed to.
If we want to deal only with whole numbers we stop with 14%: 14 per 100.
But a contractor might want to know what does a rate of 14.29% mean for 1,000,000 houses: 14.29 for every 100 means 142,900 for every 1,000,000.
So percentages expressed as decimals are a useful bookkeeping device for comparing rates across different populations.
The percentage calculation compares a rate to an amount per 100.
Another percentage calculation is to figure Shaquille O’Neal’s field goal percentage (FG%) during the 2008-09 season, given that he scored 609 times out of 1,000. FG% is usually written as a 3 digit decimal, in this case .
But this is NOT a percentage: . Shaq O’Neill scored 60.9% of the time.
Why 100? Why not 1000? 1,000,000? Or some other number?
The origins lie, apparently, in commercial practice in the Middle Ages. Monetary units of size 100 were commonly used to compare prices, and the terminology “per cent” ( “for every 100”) came into common use. Ancient Greeks also compared amounts to standardized amounts per 100, but did his is ratios, because they dd not have fractions or decimal numbers.
Postscript
Percentages, particularly those involving change, fool not only TV personalities, but scientists and science writers as well.
The article “Lots of Inumerate Ink: Penguins suffer when tagged. Do the math. Most journos didn’t.” discusses a Nature article on flipper-banding of penguins. They report:
The paper and Nature’s summary for reporters both say that flipper-banded penguins had a 16 percent lower ten-year survival rate. ![]()
By contrast, the accompanying data results table says that chances of surviving for ten years fell from 0.36 to 0.20. Well, subtract those two and one does get 0.16 or 16 points difference, but as our alert AP man saw, what’s important is not that the rate fell 16 points but that 0.20 is about a 44 percent drop from 0.36.
The relevant calculation for the fractional change is and, of course,


January 25, 2011 at 6:31 am
An interesting aside to this.
Here is my state (South Australia) grocery shops such (such as Woolworths) have had to indicate on their price tags, the price per 100g/100mL.
This enables easy comparison. I haven’t done it yet, but I think this is an excellent ‘real-world’ example of how useful percentages can be.
I hope to use it with my Year 9 class this year.